 Hack the Route Start learning Open app
The idea
Every evening around eight, Thornvale's internet slows down, and Dervla hears about it from the village group chat. She volunteers for Thornvale Broadband, the co-op that runs the village's one line to the outside world. She wants the line to tell her first, so she has put Prometheus on a small box beside the co-op's Router.
Steps
-
Ask Prometheus who answers
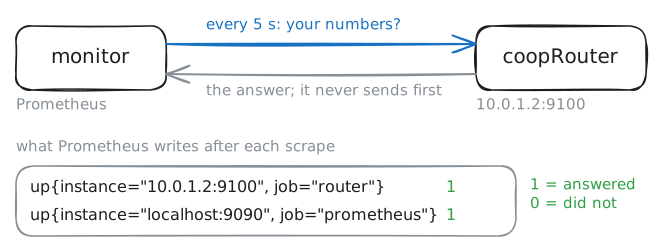
Prometheus is a program that collects numbers. Every few seconds it asks each machine on its list for its current numbers, and it keeps every answer with the time it came in. Asking is called a scrape, and each machine on the list is a target.
The machines don't send anything on their own. Prometheus goes and gets it, the way an SNMP poller asks a router for its counters. So the one doing the asking always knows when a machine has gone quiet.
On
monitor, Prometheus scrapes two targets every 5 seconds: itself, andcoopRouterat 10.0.1.2, port 9100. After each scrape it writes down a few numbers of its own, and the first isup: 1 when the target answered, 0 when it didn't.promtoolis Prometheus's command-line client.promtool query instantsends a Prometheus server a question, a query, and prints the answer as it stands right now. Ask the Prometheus onmonitor, athttp://localhost:9090, forup.monitor:~# promtool query instant http://localhost:9090 up
-
Read the router's counters
So what does a scrape fetch? A web page.
On
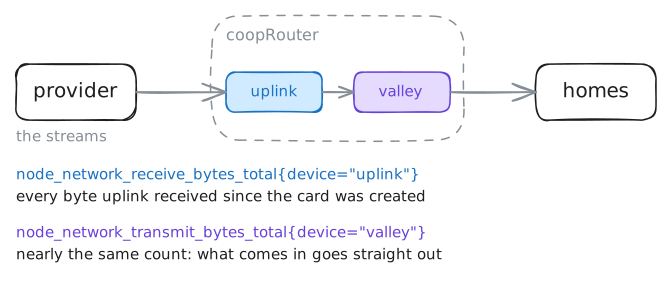
coopRouter, a small program called node_exporter reads the router's own numbers from Linux and serves them athttp://10.0.1.2:9100/metrics, as plain text, one number to a line. A program that serves something's numbers like this is an exporter, and there are exporters for switches, databases, printers and nearly anything else.This one only reports the router's two cards:
valley, facing the village's homes, anduplink, the line to the provider.Most of what it serves are counters. A counter only ever goes up, like a car's odometer: each card's counters start at 0 when the card is created, at boot for a real one, and add every byte and packet from then on. The other kind is a gauge, a number that goes up and down, like a temperature or the free space on a disk.
The village has been streaming at about 20 Mbit/s since the lab started. Fetch the page from
monitor, the way Prometheus does every 5 seconds.monitor:~# curl -s http://10.0.1.2:9100/metrics
-
Turn a counter into megabits
A counter alone says little. 48 million bytes since the card was created: is that a busy line or a quiet one? It depends on how long ago that was.
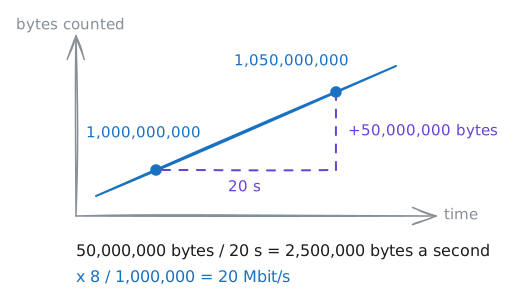
What Dervla wants is a speed, and a speed takes two readings: how much the counter grew, divided by the seconds between them.
That's what
rate()does. It's part of PromQL, Prometheus's query language, andrate(node_network_receive_bytes_total{device="uplink"}[20s])reads like this:node_network_receive_bytes_total{device="uplink"}: the metric, but only the series whosedevicelabel isuplink. Braces pick series by their labels.[20s]: its values from the last 20 seconds, four scrapes' worth.rate(...): how fast it grew across them, per second.
Nobody talks about a line in bytes a second, so the query goes on.
* 8turns bytes into bits, and/ 1000000turns bits into megabits.Run it on
monitor, and see how near the village's evening comes to the line's 100.monitor:~# promtool query instant http://localhost:9090 'rate(node_network_receive_bytes_total{device="uplink"}[20s]) * 8 / 1000000' -
Block the scrape on purpose
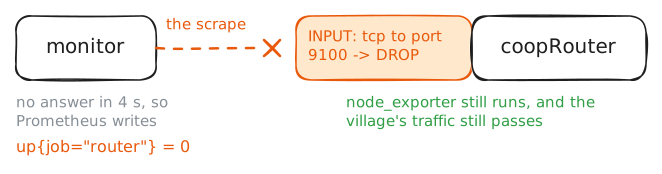
What happens to the numbers when the router stops answering? Find out on purpose, while you know exactly what you broke. It's the cheapest way to learn what a real outage will look like.
A Firewall rule on
coopRouterthat drops packets to TCP port 9100 does it. The router keeps carrying the village's traffic and node_exporter keeps running, but Prometheus's scrapes get no answer at all. WithDROP, the router throws the packets away without a word, so each scrape waits out its timeout, 4 seconds here, and gives up.iptableskeeps a machine's packet rules in lists called chains, andINPUTis the one for packets addressed to the router itself. Block it oncoopRouterand ask foruponmonitor. Then delete the rule with-D, the same rule with the other letter, and ask again.coopRouter:~# iptables -I INPUT -p tcp --dport 9100 -j DROP monitor:~# promtool query instant http://localhost:9090 up coopRouter:~# iptables -D INPUT -p tcp --dport 9100 -j DROP monitor:~# promtool query instant http://localhost:9090 up
-
Write an alerting rule
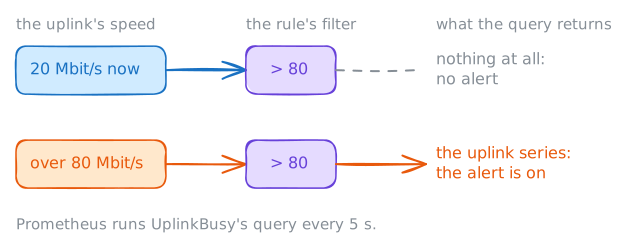
Dervla wants a warning before the village chat lights up, and Prometheus has that built in. An alerting rule is a query Prometheus runs on its own, every 5 seconds here: its evaluation interval. Whenever the query returns anything, the alert is on.
That works because a comparison in PromQL is a filter.
... > 80keeps the series whose value is over 80 and drops the rest, so under 80 the query returns nothing at all. And nothing means no alert.A rule also gets a
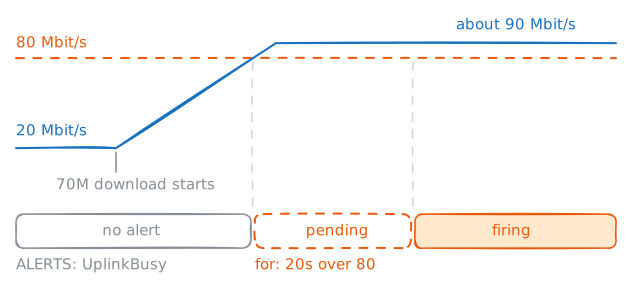
for:, how long the query must keep returning the series before the alert counts. That way one busy scrape doesn't wake anyone. Until then the alert is pending, and after it, firing.The co-op's line is 100 Mbit/s, and Dervla wants to hear at 80. Add a rule named
UplinkBusyto/etc/prometheus/rules.ymlonmonitor, underTargetDown: the speed query from before with> 80on the end, andfor: 20s.The file is YAML, where indentation says what belongs to what, so the new rule's lines start in the same columns as
TargetDown's. Then run the rule's query yourself.monitor:~# promtool query instant http://localhost:9090 'rate(node_network_receive_bytes_total{device="uplink"}[20s]) * 8 / 1000000 > 80' -
Fill the line and watch the alert fire
Time for an evening peak. On
homes, one more household starts a big download now, 70 Mbit/s on top of the village's 20, for up to 10 minutes.iperf3plays the download: it's a tool for measuring how fast a network carries data, and it sends as fast as you ask.iperf3 -c 10.0.2.10 -p 5202: be a client of the iperf3 server onprovider, port 5202.-R: reverse, so the provider sends andhomesreceives, like a download.-b 70M: 70 megabits a second.-t 600: for 600 seconds at most. It stops once you've seen the alert fire.
It runs in the background while you watch.
rate()averages over 20 seconds, so the speed climbs past 80 about 15 seconds after the start.Prometheus keeps its active alerts as a series too,
ALERTS. Each carries the alert's name, the labels of the series that set it off, andalertstate,pendingorfiring. Ask forALERTSonce it's pending, and again once it fires.homes:~# iperf3 -c 10.0.2.10 -p 5202 -R -b 70M -t 600 monitor:~# promtool query instant http://localhost:9090 ALERTS monitor:~# promtool query instant http://localhost:9090 ALERTS
Run these steps on real machines