 Hack the Route Start learning Open app
The idea
Farah keeps the small security desk at Alderwood Press, a newspaper. A rival paper lost a week of drafts to malware that called home: it opened a connection to the same outside host on a fixed timer, with the same tiny request each time. Farah wants to know whether her own flow logs would have caught it, so she puts an inert sample that behaves the same way on an editor's workstation and hunts for it.
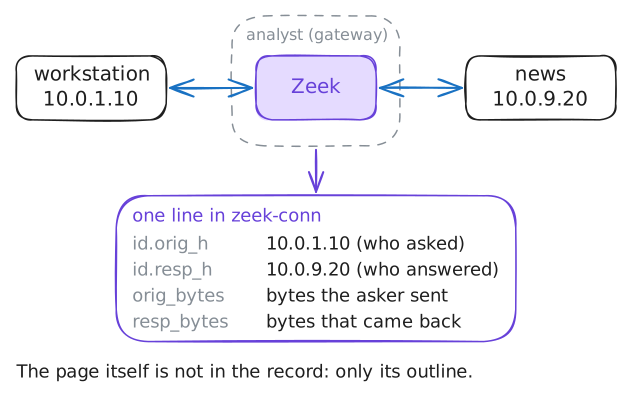
Nothing in the sample's request is dangerous, and the page it fetches is harmless. What a real implant would hide is the pattern itself: a machine quietly checking in with its operator, waiting for orders. Farah's analyst machine sits in-path on the office uplink (every packet leaving the office passes through it), so Zeek writes down every flow that crosses, one line per connection: who talked to whom, and how much.
She will not open a single payload. She will catch the implant by the shape of its traffic: chattier than it should be, identical every time, and on a clock no person keeps.
Steps
-
One line per conversation
Before its contents, traffic has a shape. A flow record is the connection's summary. Zeek writes one per connection in its
conn.log, indexed here aszeek-conn, and each holds the source and destination address, ports, how many bytes each side sent, and how long it lasted, with no payload at all.The netflow-talkers lab is where these records are introduced; here you hunt a pattern inside them. Start by asking who talks to whom, and how often: count the flows for each source-and-destination pair and sort by the count.
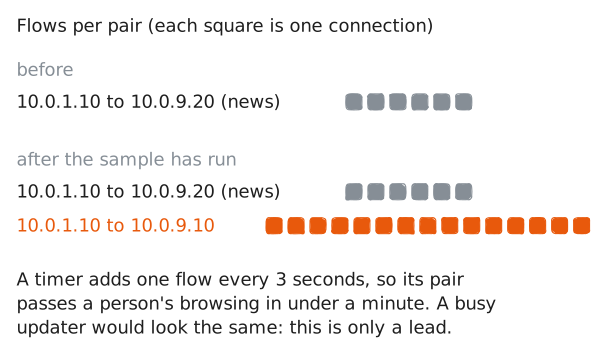
This is how a security operations centre reads a network for the first time, the top talkers. On a quiet office network nothing should stand out: a workstation fetching a few pages from a news site, varied and occasional. Read that baseline now, before anything is running, so you know the shape of an ordinary afternoon.
analyst:~# curl -s 'localhost:9200/_plugins/_ppl?format=csv' -H 'content-type: application/json' -d '{"query":"source=zeek-conn | stats count() as flows by id.orig_h, id.resp_h | sort - flows"}' -
Start the implant
Run the inert sample Farah placed on the workstation. It is a short script that fetches one fixed URL from an outside host, sleeps, and does it again: a harmless stand-in for an implant calling home. It carries no exploit; what it imitates is the behaviour, the steady check-in.
Give it a moment to beat several times, then read the top talkers again. A process that calls home every few seconds piles up connections fast, so one source-and-destination pair climbs far above the rest.
Volume alone is a lead, not a verdict. A busy software updater or a news ticker can be chatty too. What you have is a pair worth a closer look: the workstation and one outside address it will not stop talking to.
workstation:~# sh /opt/implant/beacon.sh analyst:~# curl -s 'localhost:9200/_plugins/_ppl?format=csv' -H 'content-type: application/json' -d '{"query":"source=zeek-conn | stats count() as flows by id.orig_h, id.resp_h | sort - flows"}' -
The same size, every time
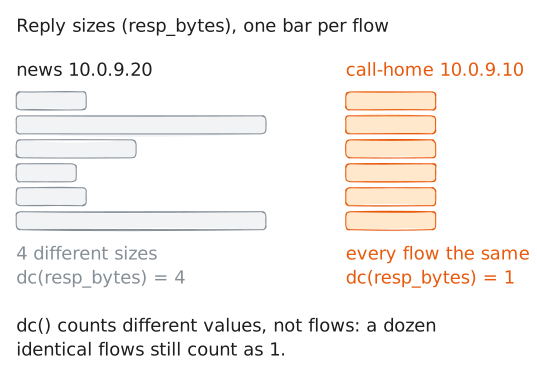
A person's web traffic is never twice the same: different pages, different sizes, a click here and a pause there. An automated check-in is the opposite: the same request, the same reply, byte for byte, as often as the timer fires.
So measure the variety of each destination's flows. For every outside host, count its flows and the number of distinct request sizes (
orig_bytes) and reply sizes (resp_bytes) it received.dc()is distinct count: how many different values a field took. Normal browsing shows several of each; a beacon shows exactly one.For the call-home host the counts should read 1 and 1, every check-in identical. That sameness is the fingerprint of a machine, not a person, and it is a far stronger sign than volume alone.
analyst:~# curl -s 'localhost:9200/_plugins/_ppl?format=csv' -H 'content-type: application/json' -d '{"query":"source=zeek-conn | stats count() as flows, dc(orig_bytes) as reqsizes, dc(resp_bytes) as respsizes by id.resp_h | sort - flows"}' -
On a clock no person keeps
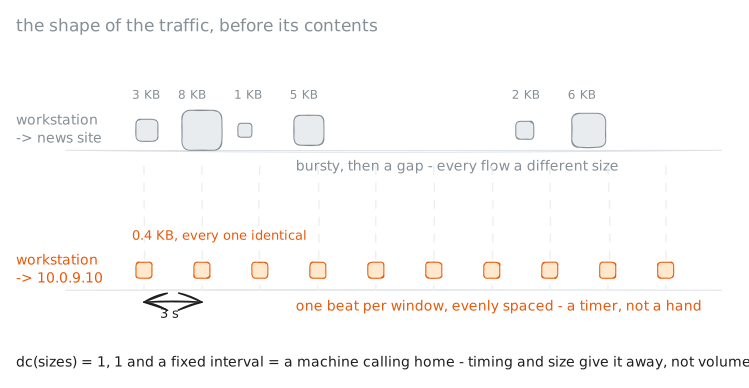
The last sign is timing. People are bursty: a flurry of requests, then nothing for minutes. A beacon is a metronome: one connection every few seconds, around the clock, because a timer drives it, not a hand.
Bucket the call-home flows into short windows of time and count how many fall in each.
span(@timestamp, 3s)groups the flows into three-second windows. If the implant beats every three seconds, each window holds exactly one, and the window timestamps step forward evenly, with no gaps and no bursts.Here the interval is three seconds so the lab finishes in under a minute; a real implant might check in once an hour, or once a day, to stay quiet. A beacon that slow would never top the talkers, so timing and size, not volume, are what find it. The tell is the regularity, not the speed: a rhythm too even to come from a person. Real implants are often not a perfect metronome, so a hunter weighs how consistent the interval stays over time, not whether every gap is identical.
analyst:~# curl -s 'localhost:9200/_plugins/_ppl?format=csv' -H 'content-type: application/json' -d '{"query":"source=zeek-conn | where id.resp_h = \"10.0.9.10\" | stats count() as beats by span(@timestamp, 3s) as window | sort window"}' -
Turn it into something to hunt
You have called it: a beacon. The last move is to make the finding portable: an indicator to sweep every host for, not one machine you happened to look at.
The check-ins are HTTP, so Zeek also logged them in
zeek-http, with the client's user-agent string, the name a program gives for itself in each request. Read it for the call-home host. Malware often carries a tell-tale agent its author never bothered to disguise; this sample's isAlderwoodBeacon/1.0.With that string in hand you stop hunting one workstation and start hunting a behaviour: any host whose flows carry that agent, or that beat to the same address on the same clock, is running the same implant. That is how one caught machine becomes a network-wide sweep.
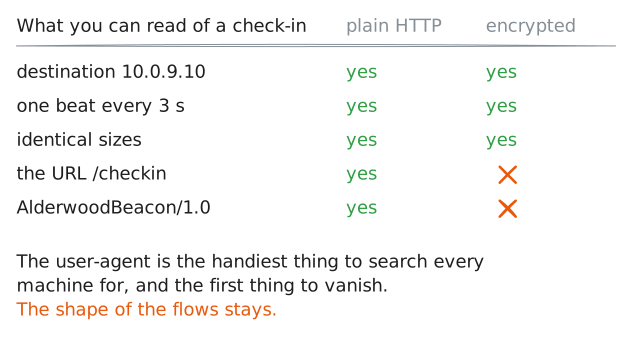
A user-agent is a weak indicator on its own, one line of text an author can change at will, and it is readable here only because the check-ins are plain HTTP. Over an encrypted channel the URL and the agent vanish, yet the flow shape does not: the cadence, the identical sizes and the destination still show. That is why you hunted the shape of the traffic, not its contents.
analyst:~# curl -s 'localhost:9200/_plugins/_ppl?format=csv' -H 'content-type: application/json' -d '{"query":"source=zeek-http | where id.resp_h = \"10.0.9.10\" | stats count() as beats by user_agent"}'
Run these steps on real machines