 Hack the Route Start learning Open app
The idea
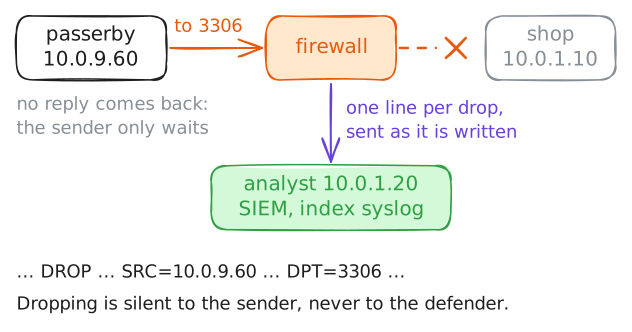
Isak runs the small IT team at Marrow Lane Brewery, which sells its beer through an online shop. At the edge of the brewery's network sits a firewall: it lets the public reach the shop, turns away everything else, and writes down each packet it turns away: one line per refusal, sent to the SIEM the moment it happens.
A firewall log is a different kind of evidence from a host log. A host log is what one machine saw happen to it; the firewall log is what crossed the boundary, or tried to. When someone out on the internet goes looking for a way in, the firewall is the first thing they touch, and the first thing to write it down.
This morning the drop log is filling faster than a quiet brewery's should. Isak wants to know who is knocking and whether it is a port scan. Most of all he wants the one door the scan found open, so he can shut it.
Steps
-
A firewall that keeps the receipts
A firewall decides, packet by packet, what may cross between the inside and the outside. The brewery's rule is simple: let new connections reach the shop's web port, let replies back to connections it already saw, and drop everything else. A dropped packet goes nowhere and gets no reply, so the sender is left waiting.
Dropping is silent to the sender, but not to the defender. The firewall's last rule carries
log, so every packet it drops it also records: one line with the time, the source and destination address, the protocol, and the port asked for. Those lines go straight to the SIEM as they are written, and you query them there like any other log.Start by counting the drops. PPL reads left to right like a pipeline: start at an index (
syslog, where the forwarded firewall lines land), keep the lines that holdDROP, and count them. On a quiet morning this is a small number: the odd stray packet the internet always throws at any public address.analyst:~# curl -s 'localhost:9200/_plugins/_ppl?format=csv' -H 'content-type: application/json' -d '{"query":"source=syslog | where like(message, \"%DROP%\") | stats count() as drops"}' -
Someone sweeps the edge
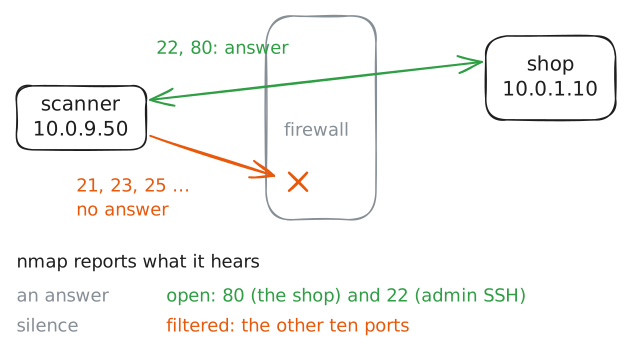
Here comes the knocking. A host out on the internet runs a port scan against the brewery's edge: it sends a connection request to one port after another and watches what comes back.
An open port answers; a dropped one stays silent. From the few that answer, the scanner learns what the brewery runs and where it might push.
The brewery's own machines sit on
10.0.1.0/24, with the shop at10.0.1.10. The scanner is out past the firewall on10.0.9.0/24, this lab's stand-in for the open internet.Run the scan from that host.
nmapis the standard tool:-Pntells it not to ping first (the firewall drops pings too),-nskips name lookups, and-pgives the list of ports to try.For this one step you sit in the attacker's seat, so the firewall has traffic to record. Then you switch back to Isak and read what it left behind.
MITRE ATT&CK files this reconnaissance under Network Service Discovery (T1046): find the services a host exposes before choosing where to strike.
scanner:~# nmap -Pn -n --max-retries 2 -p 21,22,23,25,80,139,445,3306,3389,5432,8080,8443 10.0.1.10
-
One address, knocking everywhere
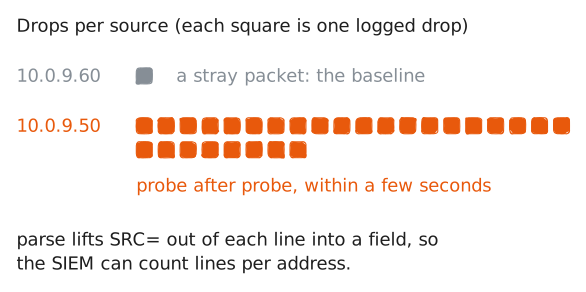
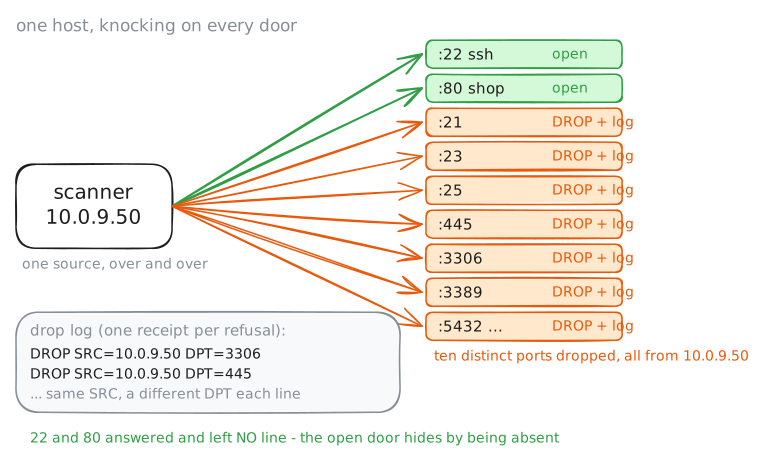
Back to Isak's seat. The scan sent a request to every port on the list, and the firewall dropped and logged all but the two it forwards. So the drop log filled in a few seconds, and every one of those lines carries the same source address.
Ask the SIEM who the drops came from.
The line records the source as
SRC=followed by the address, which PPL'sparsecan lift out of the message into a field of its own:parse message ".*SRC=(?<src>[0-9.]+) .*"reads an address afterSRC=and names itsrc. Then count the drops per source, busiest first. The leading-insort - dropsmeans descending.A quiet network's drop log is a spread of single stray packets from many addresses. A scan is the opposite: one address, over and over, in a few seconds.
analyst:~# curl -s 'localhost:9200/_plugins/_ppl?format=csv' -H 'content-type: application/json' -d '{"query":"source=syslog | where like(message, \"%DROP%\") | parse message \".*SRC=(?<src>[0-9.]+) .*\" | stats count() as drops by src | sort - drops"}' -
Many doors, one knocker
A busy source is a lead, not yet a verdict. A broken script or a noisy backup could hammer one port many times. What marks a scan is spread: one source reaching for many different ports in a short time, trying each door in turn.
So count the distinct destination ports each source was dropped on.
DPT=on each line is the port the probe asked for.Parse it out alongside the source, and
dc(dport)(distinct count) gives how many different ports that source tried. A real client talks to one or two; a scanner sweeps a dozen or more.Lean on that distinct count, not the raw drop total. A silently dropped probe gets retried, and the lines travel to the SIEM over UDP, which can lose a packet now and then. So the tally wobbles from run to run, while the spread of ports holds.
This is the vertical shape: one host, many ports. The same log catches its mirror image, one port across many hosts, if you count distinct destination addresses per source instead. On a real network you would also bound the count to a time window, since over a long enough stretch a busy client, or many users behind one shared address, reaches many ports without scanning.
analyst:~# curl -s 'localhost:9200/_plugins/_ppl?format=csv' -H 'content-type: application/json' -d '{"query":"source=syslog | where like(message, \"%DROP%\") | parse message \".*SRC=(?<src>[0-9.]+) .*DPT=(?<dport>[0-9]+).*\" | stats dc(dport) as ports, count() as drops by src | sort - ports"}' -
The door the log did not mention
A drop log has a blind spot: it records what the firewall blocked, so it says nothing about what the firewall let through. The ten ports in the log are the ones that were safely refused. The danger is the port that is not in the log, the one the firewall forwarded.
The scanner's own output already showed it:
22/tcp open. Port 22 is SSH, the brewery's admin login, and anyone on the internet can reach it and start guessing common passwords until one works. It never shows in the drop log, because the firewall allowed it.Read the log and the scan result together: the log names the scanner, the scan names the hole.
Here the scan handed you that open port for free. In a real incident you have no attacker's output to read. You would find the same exposure in the firewall's accept log, a flow record, or the shop's own SSH log, because a drop log alone never names an open door.
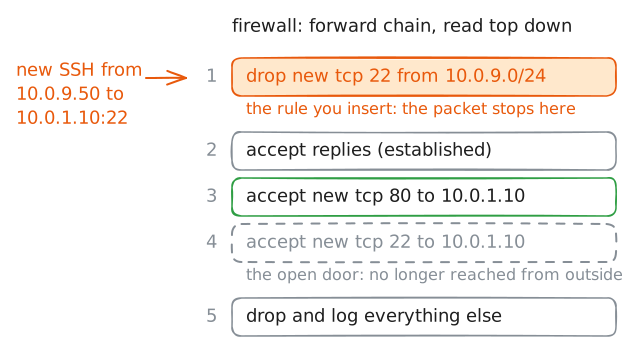
Shut it. The firewall should drop new SSH connections coming from the internet, the same as it drops everything else it does not serve. Add that rule ahead of the one that lets 22 through, then confirm the scanner can no longer reach it.
firewall:~# iptables -I FORWARD 1 -s 10.0.9.0/24 -d 10.0.1.10 -p tcp --dport 22 --syn -j DROP
scanner:~# nmap -Pn -n -p 22 10.0.1.10
Run these steps on real machines