 Hack the Route Start learning Open app
The idea
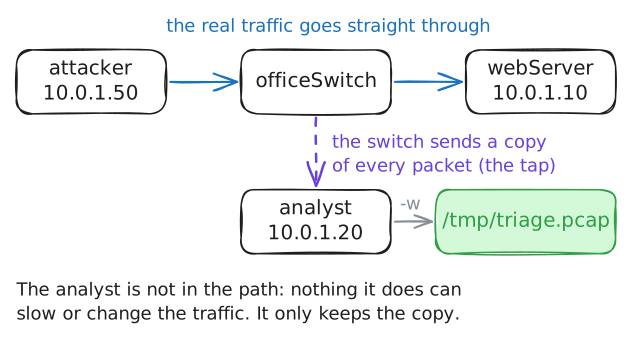
Oskar runs the small security operations centre (SOC) at Vellmar Games, the team that watches the office network. A tap on the office switch copies the staff portal's traffic to his analyst machine, and he records it to a file every night. Last night something hammered the portal, and the recording is all he has to go on.
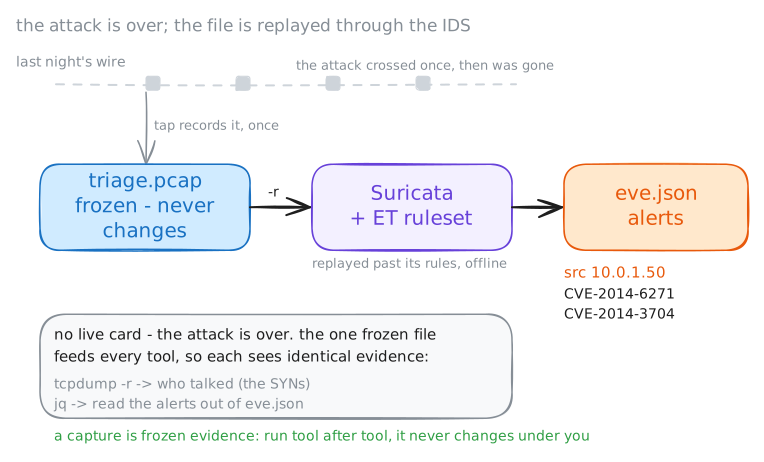
This is offline triage, or pcap analysis: you read a saved capture (a .pcap file) after the fact, so the evidence never changes under you. You
record the file, let Suricata read it, and follow the alerts to the host that attacked.
Steps
-
Record the tap to a file
A tap (or SPAN port) is the switch copying one port's traffic to another. The analyst machine sees the web server's whole conversation without sitting in its path. Oskar does not watch that stream live. He records it to a
.pcapfile and works the file afterwards. A capture file holds every packet byte for byte, and once saved it never changes, so every tool you run reads the same evidence.tcpdump -wwrites packets to a file instead of printing them. Start the recorder the way Oskar does each evening, let the night's traffic cross, then stop it. Then read the file back, asking only for each connection's opening packet, to see who talked to the server at all.analyst:~# tcpdump --immediate-mode -ni eth0 -U -w /tmp/triage.pcap analyst:~# tcpdump -nr /tmp/triage.pcap 'tcp[tcpflags] & tcp-syn != 0 and tcp[tcpflags] & tcp-ack == 0'
-
Let the IDS read the capture
Reading every packet by hand does not scale. An intrusion detection system (IDS) carries thousands of signatures, patterns of known attacks, and flags any packet that matches one. Suricata is one such engine. It reads a saved file as readily as live traffic from a network card: point it at the
.pcapand it runs every packet past its rules.Oskar's analyst machine has Suricata with the Emerging Threats Open ruleset, tens of thousands of signatures written by the community. Suricata writes its findings to
eve.json, one JSON record per line, with analertrecord for every rule that matched.analyst:~# suricata -r /tmp/triage.pcap -l /tmp/out -c /etc/suricata/netlab.yaml
-
Read the alerts
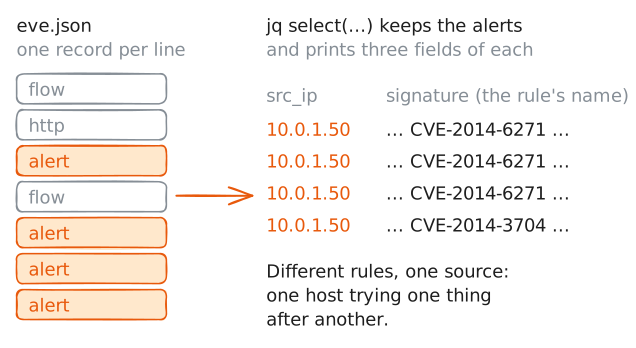
eve.jsonholds one JSON record per line, of several kinds:flow,http,alert. You want the alerts.jqpicks fields out of JSON:select(...)keeps only the records you ask for, and[...] | @tsvprints the fields you name as a table, one row per record.Pull three fields from every alert: the source that set it off, the alert's category, and its signature, the name of the rule that matched. Triage starts here. Not every packet, only what the sensor flagged, and where it came from.
analyst:~# jq -r 'select(.event_type=="alert") | [.src_ip, .alert.category, .alert.signature] | @tsv' /tmp/out/eve.json
-
Confirm it in the packets
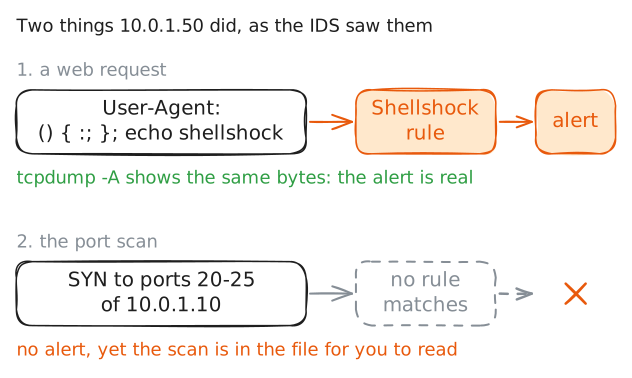
An alert is a lead, not a verdict. To confirm it, go back to the packet the rule matched. Read the capture again, this time printing the contents of the suspect host's web requests as text.
tcpdump -Aprints each packet as ASCII text. The request itself is readable, wrapped in packet header bytes that show up as noise. Plain HTTP is not encrypted, so the requests come out whole, headers and all.analyst:~# tcpdump -nr /tmp/triage.pcap -A 'src host 10.0.1.50 and tcp port 80 and greater 100'
Run these steps on real machines